Overview
This page provides guidelines for the tutorial on iCOMOT - Toolset for Managing IoT Cloud Systems. All the scripts and examples of iCOMOT is published on Github.
Steps:
- Deploy and run iCOMOT
- Using iCOMOT Utility Tools to develop sensor and gateway units
- Describe an IoT cloud based elastic data-center using iCOMOT API
- Deploy the service on Docker/OpenStack using SALSA
- Query the capabilities of the service using ELISE
- Monitor and analyze the service using MELA
- Control the service's elasticity using rSYBL
- Apply IoT governance policies using GovOps
Requirements
iCOMOT is implemented as a service oriented distributed platform, in which multiple standalone services interact to provide complete functionality, from describing, to monitoring and controlling elastic services
Resource requirements
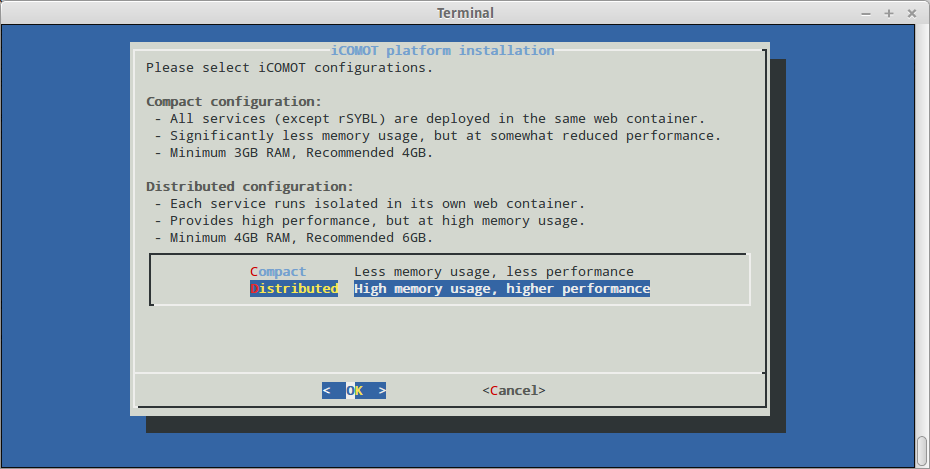
To increase usability, we provide two deployment configurations for iCOMOT:
- Distributed deployment:
- Each service runs isolated in its own web container
- Provides high performance, but at high memory usage
- Minimum 4GB RAM, Recommended 6GB
- Compact deployment:
- All services except elasticity control are deployed in the same web container
- Significantly less memory usage, but at somewhat reduced performance.
- Minimum 3GB RAM, Recommended 4
Software requirements
The setup was tested and tailored for Ubuntu 14.04 and Ubuntu 14.10
Configuration
By default iCOMOT comes only with support for Docker configured. If OpenStack or Flexiant support is needed, please download the cloudUserParameters.ini file, fill in the usual connector details, and place it in /etc/cloudUserParameters.ini
Deploying iCOMOT
Built and ready to use versions of iCOMOT are available in iCOMOT github and our maven repository. The GIT repository also contains the software artifacts for the elastic service used in the Demo.
We provide separate install and uninstall scripts for both compact or distributed iCOMOT deployments. Depending on the desired platform, please use the appropriate scripts.
Note 1: Deploying iCOMOT will download about 800 MB - 1GB of data, containing the iCOMOT platform, and used docker image.
Note 2: While the steps below are exemplified for the iCOMOT compact deployment, the same approach applies to the distributed deployment version
For deploying iCOMOT, clone the GIT repository, change to the bin folder and execute the installation script:
 $ git clone https://github.com/tuwiendsg/iCOMOT.git
 $ cd iCOMOT/bin
 $ bash install.sh
The installation process is shown through a set of configuration steps.
- Select the compact deployment or distributed deployment.
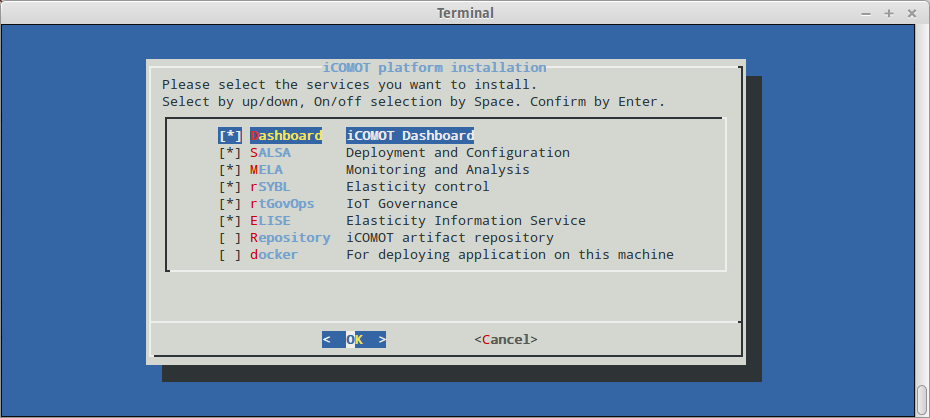
- Select which services will be installed.
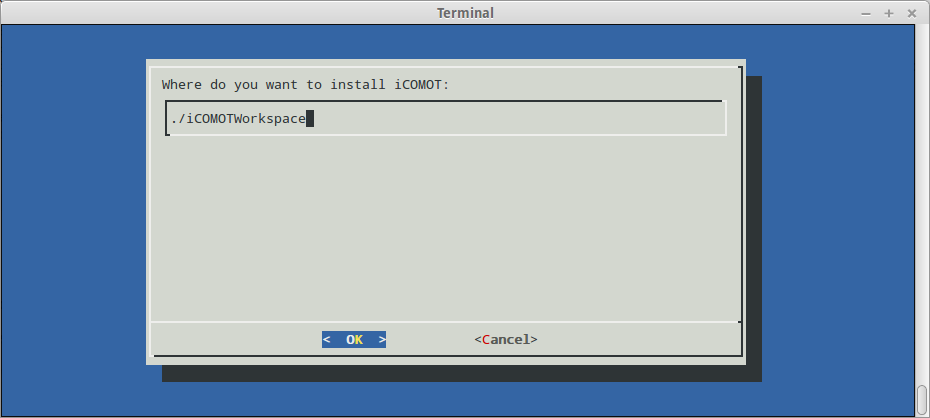
- Input the installation directory for iCOMOT (some script is installed in /etc/init.d instead of installation directory).
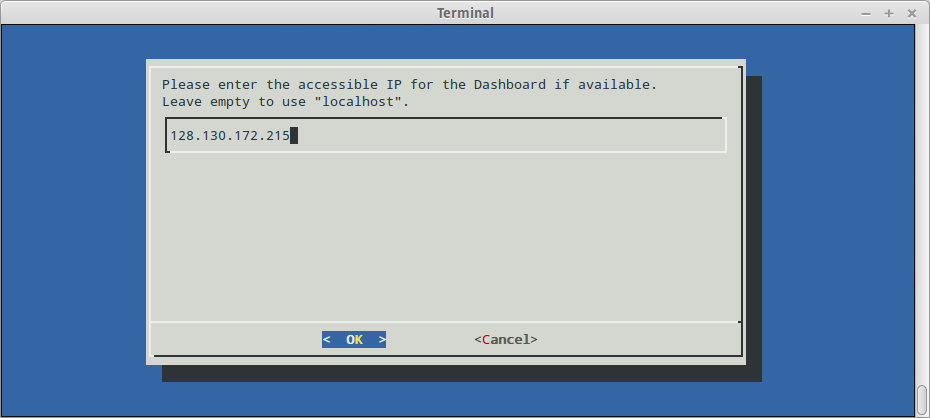
- If DashBoard is selected to be installed, a window appear and ask for a publicly accessible IP.
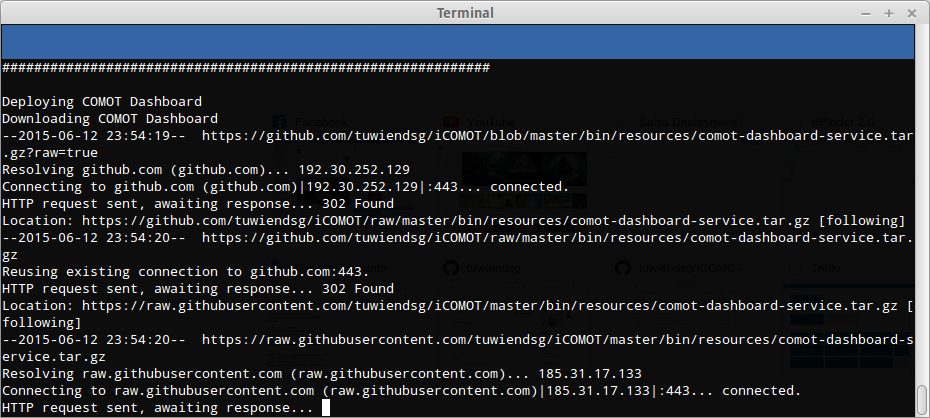
Screenshot of the installation process as below (click to expand)
For starting, stopping or uninstalling iCOMOT, please run the command lines as followings
$ sudo service icomot-services start
 * Starting iCOMOT services
 ...
 iCOMOT started. Please access iCOMOT Dashboard at http://localhost:8080/iCOMOT
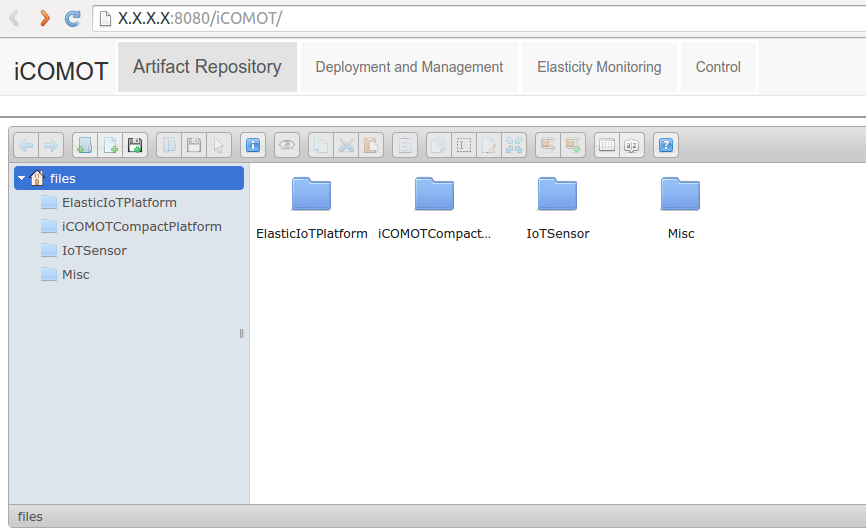
If deployment is successful, the iCOMOT Dashboard should be accessible as below:
iCOMOT services can be managed separatedly with following commands
$ sudo service salsa-engine-service start|stop|restart|status
$ sudo service ganglia-monitor start|stop|restart|status
$ sudo service mela-data-service start|stop|restart|status
$ sudo service mela-analysis-service start|stop|restart|status
$ sudo service rSYBL-service start|stop|restart|status
$ sudo service elise-service start|stop|restart|status
$ sudo service comot-dashboard-service start|stop|restart|status
To stop the whole services or to undeploy iCOMOT services, please run followings
 $ sudo service icomot-services stop
 ...
 $ bash ./uninstall_iCOMOT.sh
 ...
Tutorial 1: Using iCOMOT Utility Tools to Develop Sensor and Gateway Units
Simulated sensors and gateways
Simulated sensors can be used in the development to simulate the sensory data. In our demo, a simulated sensors consists of three parts: the sensor runtime, the data and the configuration scripts.The gateways are used to host and simulate different sensors. Different components of one gateway are bundled in a Docker container with the capability to host sensors, to register and decommission with the IoT Governance. Generally, iCOMOT's agents are preinstalled in the gateways to enable it to manage such gateways during application runtime.
Downloading and installing the SensorGatewayUtil
The SensorGatewayUtil tool can be obtained in two ways: by cloning the whole iCOMOT toolset, as described earlier or it can be manually downloaded and installed as a standalone tool. To install it as a standalone tool, one can run the following command: $ wget https://github.com/tuwiendsg/iCOMOT/blob/master/bin/SensorGatewayUtil.sh
$ ./SensorGatewayUtil.shCreating your first iCOMOT virtualized sensor and gateway
The SensorGatewayUtil tool supports two modes to create a virtual sensor or a virtual gateway: batch mode and interactive mode.- Batch mode: The user runs the utility by passing parameters to configure the sensor/gateway. In the case that one or some parameters are missing, the default values will be used. An error can occur if the parameters are incorrect and the sensor/gateway is not created (e.g. user provides wrong dataset).
- Interactive mode: The interactive mode guides the user through a set of question and validate the configuration before creating sensor/gateway. To use this mode, please run the utility with -i argument. The interactive mode also parses the parameter as in batch mode as default configurations.
The output of the interactive mode should look like this:
$ bash SensorGatewayUtil.sh sensor -i
Interactive mode for creating sensor
Input a name for the sensor/gateway [sensor]: locationSensor
Dataset [./data.csv]: ./gps1290.csv
Maximum lines to extract from the dataset (0 for all lines) [0]: 1000
Columns to extract from the dataset (leave empty for all) []: 2,3
Sensor protocol [dry] (dry|mqtt|coap|smap): dry
Sensor frequency [5]: 2
...
Successfully created sensor locationSensor
You can run the sensor with ./iCOMOT-simulated-devices/sensors/locationSensor/run_sensor_locationSensor.sh

$ bash SensorGatewayUtil.sh gateway -i
Interactive mode for creating gateway
Input a name for the sensor/gateway [gateway]: G1
Enter the default Dockerfile if available, or press enter to continue []:
Base image for the gateway (on Dockerhub) [ubuntu:14.04]:
GovOps-enabled? [yes]: yes
  GovOps IP [128.130.172.199]:
  GovOps Port [8080]:
Please enter the metadata for the gateway (Enter empty meta name to stop):
  Meta name:  location
  Meta value: room320
  Meta name:
Generate gateway code ...
...
The Dockerfile is generated: iCOMOT-simulated-devices/gateways/G1/Dockerfile
To generate multiple sensors from multiple datasets, batch mode can be used (please check the example folder for more details).
bash SensorGatewayUtil.sh sensor -p mqtt -s condenser_rule.csv -c 1,4 -n difference_oat_and_con_temp
bash SensorGatewayUtil.sh sensor -p mqtt -s condenser_rule.csv -c 1,3 -n motor_status
bash SensorGatewayUtil.sh sensor -p mqtt -s condenser_rule.csv -c 1,2 -n oat

bash SensorGatewayUtil.sh sensor -p mqtt -s evaporator_fouling.csv -c 1,5 -n ch2a_exv_position
bash SensorGatewayUtil.sh sensor -p mqtt -s evaporator_fouling.csv -c 1,4 -n chw_supply_temp
bash SensorGatewayUtil.sh sensor -p mqtt -s evaporator_fouling.csv -c 1,3 -n fcu_ff1_set_point
bash SensorGatewayUtil.sh sensor -p mqtt -s evaporator_fouling.csv -c 1,2 -n fcu_ff1_space_temp

bash SensorGatewayUtil.sh sensor -p mqtt -s low_suction_pressure_ch3.csv -c 1,6 -n cmn_chws_temp
bash SensorGatewayUtil.sh sensor -p mqtt -s low_suction_pressure_ch3.csv -c 1,5 -n ch3_cktA_compressor_suction_superheat_temp
bash SensorGatewayUtil.sh sensor -p mqtt -s low_suction_pressure_ch3.csv -c 1,4 -n ch3_cktA_percent_total_capacity
bash SensorGatewayUtil.sh sensor -p mqtt -s low_suction_pressure_ch3.csv -c 1,3 -n ch3_cktA_exv_position
bash SensorGatewayUtil.sh sensor -p mqtt -s low_suction_pressure_ch3.csv -c 1,2 -n ch3_cktA_suction_pressure
Specify sensors topology
The sensors topology which is deployed and managed by iCOMOT can be describe through our iCOMOT API. The examples of GPS sensors topology and Chiller sensors topology can be found at "examples/ManagingIoTCloudSystems/src/main/java/at/ac/tuwien/dsg/icomot/examples"Step to specify GPS location sensor topology and deploy
-
The sensors and gateways deployment require software artifacts (scripts, archive, Dockerfile, etc). The ready-to-use version is put in the
-distribution folder when sensors/gateways are created.We upload them into repository and specify the URL. String sensorRepo = "http://109.231.121.77/iCOMOTTutorial/files/iotDevice/sensor/"; String gatewayRepo = "http://109.231.121.77/iCOMOTTutorial/files/iotDevice/gateway/";
-
We specify the cloud infrastructure to host the sensor/gateway.
OperatingSystemUnit gatewayVM = OperatingSystemUnit("gatewayVM") .providedBy(FlexiantSmall() .withBaseImage("422a6e60-611c-304d-9317-75ed5ca949b5") ); -
The gateway is defined by the Dockerfile and sensor is defined by the script. There are additional artifacts are also specified.
	       DockerUnit gatewayDocker = DockerUnit("gatewayDocker")
	       	       .providedBy(DockerDefault())
	       	       .deployedBy(DockerFileArtifact("dockerFileArtifact", gatewayRepo + "Dockerfile"),
	       	       MiscArtifact("achieveArtifact", gatewayRepo + "rtGovOps-agents.tar.gz"));

	       ServiceUnit sensorUnit = SingleSoftwareUnit("sensorUnit")
	       	       .requires(Requirement.Variable("brokerIp_Requirement"))
	       	       .deployedBy(SingleScriptArtifact(sensorRepo + "runSensor_gps1279_LocationSensor.sh"))
	       	       .deployedBy(MiscArtifact(sensorRepo + "sensor.tar.gz"))
	       	       .withLifecycleAction(LifecyclePhase.UNDEPLOY, new BASHAction("./decommission")) ;
Note that we specified ".requires(Requirement.Variable("brokerIp_Requirement"))" to use later. The sensor can send data to a message queue, then we also define a queue service. In following, the queue service is reference to an existing deployment.ServiceUnit QueueUnit = SoftwareNode.SingleSoftwareUnit("QueueUnit") .exposes(Capability.Variable("brokerIp_Capability")) .andReference("ElasticIoTPlatform/QueueUnit"); -
After define all the service unit, we define the topology of these unit
         HostedOnRelation("dockerOnVM")
	       	       .from(gatewayDocker)
	       	       .to(gatewayVM))
	       ConnectToRelation("mqtt_broker")
	       	       .from(QueueUnit.getContext().get("brokerIp_Capability"))
	       	       .to(sensorUnit.getContext().get("brokerIp_Requirement")));
In the following videos, we show how to use SensorGatewayUtil in the interactive mode to create a simple sensor from custom data set and a gateway from custom image.
Communication protocols
In the current setup the gateways host the sensors and they are responsible to support the sensors to communicate with the cloud services. To this end we have developed several communication protocols that can be used for the communication between the sensors/gateways and the cloud services. Generally, the gateways support two types of communication: push-based and poll-based. The push-based communication is realized via the MQTT protocol, which can be configured when the sensor is created(see "Creating your first iCOMOT virtualized sensor and gateway"). Currently, we provide a mqqt client (part of the cloudconnectivity library), thus no development is required for the MQTT to be used for push-based communication. For the purposes of this demo, mostly use the MQTT to communicate the simulated sensory data. We run two instance of MQTT broker (ActiveMQ) and all the sensors/gateways send their data to this broker, which further delivers the data to the cloud services, i.e., the cloud services subscribe to a specific queues to obtain the sensory data. The poll-based communication is realized via CoAP protocol (also configurable during sensor creation). In this case the gateway will start a light-weight CoAP server (based on Californium) and the SensorGatewayUtil will automatically configure, i.e., open and map all the required ports of, the docker containers(Note that CoAP is udp based). Finally, there is an option to use a "dryrun" protocol, which is a special protocol, meant for local testing of the sensors and it only replays the date locally, e.g, to stdout.As one might have noticed, in the current demo we did not show any inter-gateway communication, because the current implementation only allows the bi-directional communication between the gateways/sensors and the cloud services. In the future, we plan to also add this support in the iCOMOT platform.
Lastly, since we are dealing with the simulated sensors, the communication between the sensors and the gateway is realized via a "replay data protocol". This means that currently the sensor reads the data from the provided data source file (see the videos above) and replays that data through the cloud connectivity protocols.In a physical setup the sensors could communicate with gateways via ZigBee, ModBus, LonWorx or directly over the wire.
Tutorial 2: Using iCOMOT Toolset to Manage IoT Cloud Systems
Elastic IoT platform for predictive maintainance
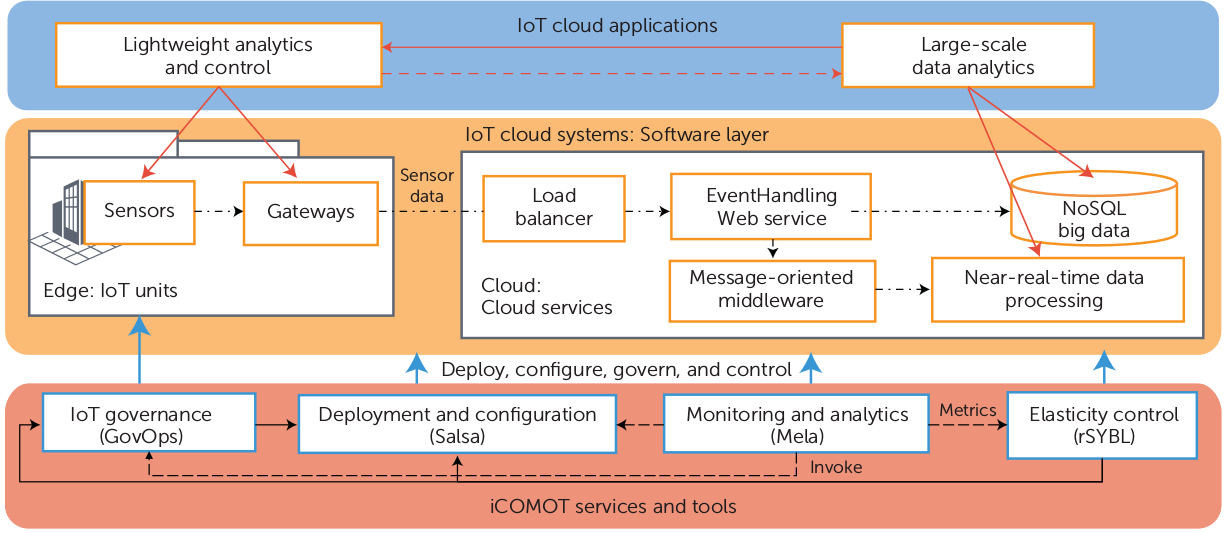
Figure 2 outlines our illustrating IoT cloud platform which must provide data for data analytic platform, where application-specific analytics will be done, and the SCU (Social Compute Unit) Provisioning platform, where human experts will carry out specific tasks as well as control IoT Cloud Platform. The IoT cloud platform can offer features for a predictive maintenance company which monitors chillers and perform data analytics (via the Data Analytics Platform) and maintenance tasks (via SCU provisioning platform). The IoT cloud platform includes gateways at the IoT part and cloud services at the data center. All of them are virtualized services, meaning that they can be deployed, configured and used on-the-fly. The predictive maintenance company will need features from the IoT cloud platform provider, which provides the right configuration of the IoT cloud platform for the predictive maintenance company. In this Demo study, we will focus on the case the predictive maintenance company wants to buy services from an IoT cloud platform provider to create a configuration of its own elastic IoT cloud platform. Then the company develops and tests different sensors which connect to its elastic IoT cloud platform to have a complete system for gathering data to support data analytics.
1. Program elasticity from a Java developer's perspective
We provide a Java-based description language/api for describing elastic cloud services, from their software artifacts, to elasticity capabilities and requirements.
We prepared a Java Maven project containing the description of the pilot elastic service, ready to be deployed and controlled
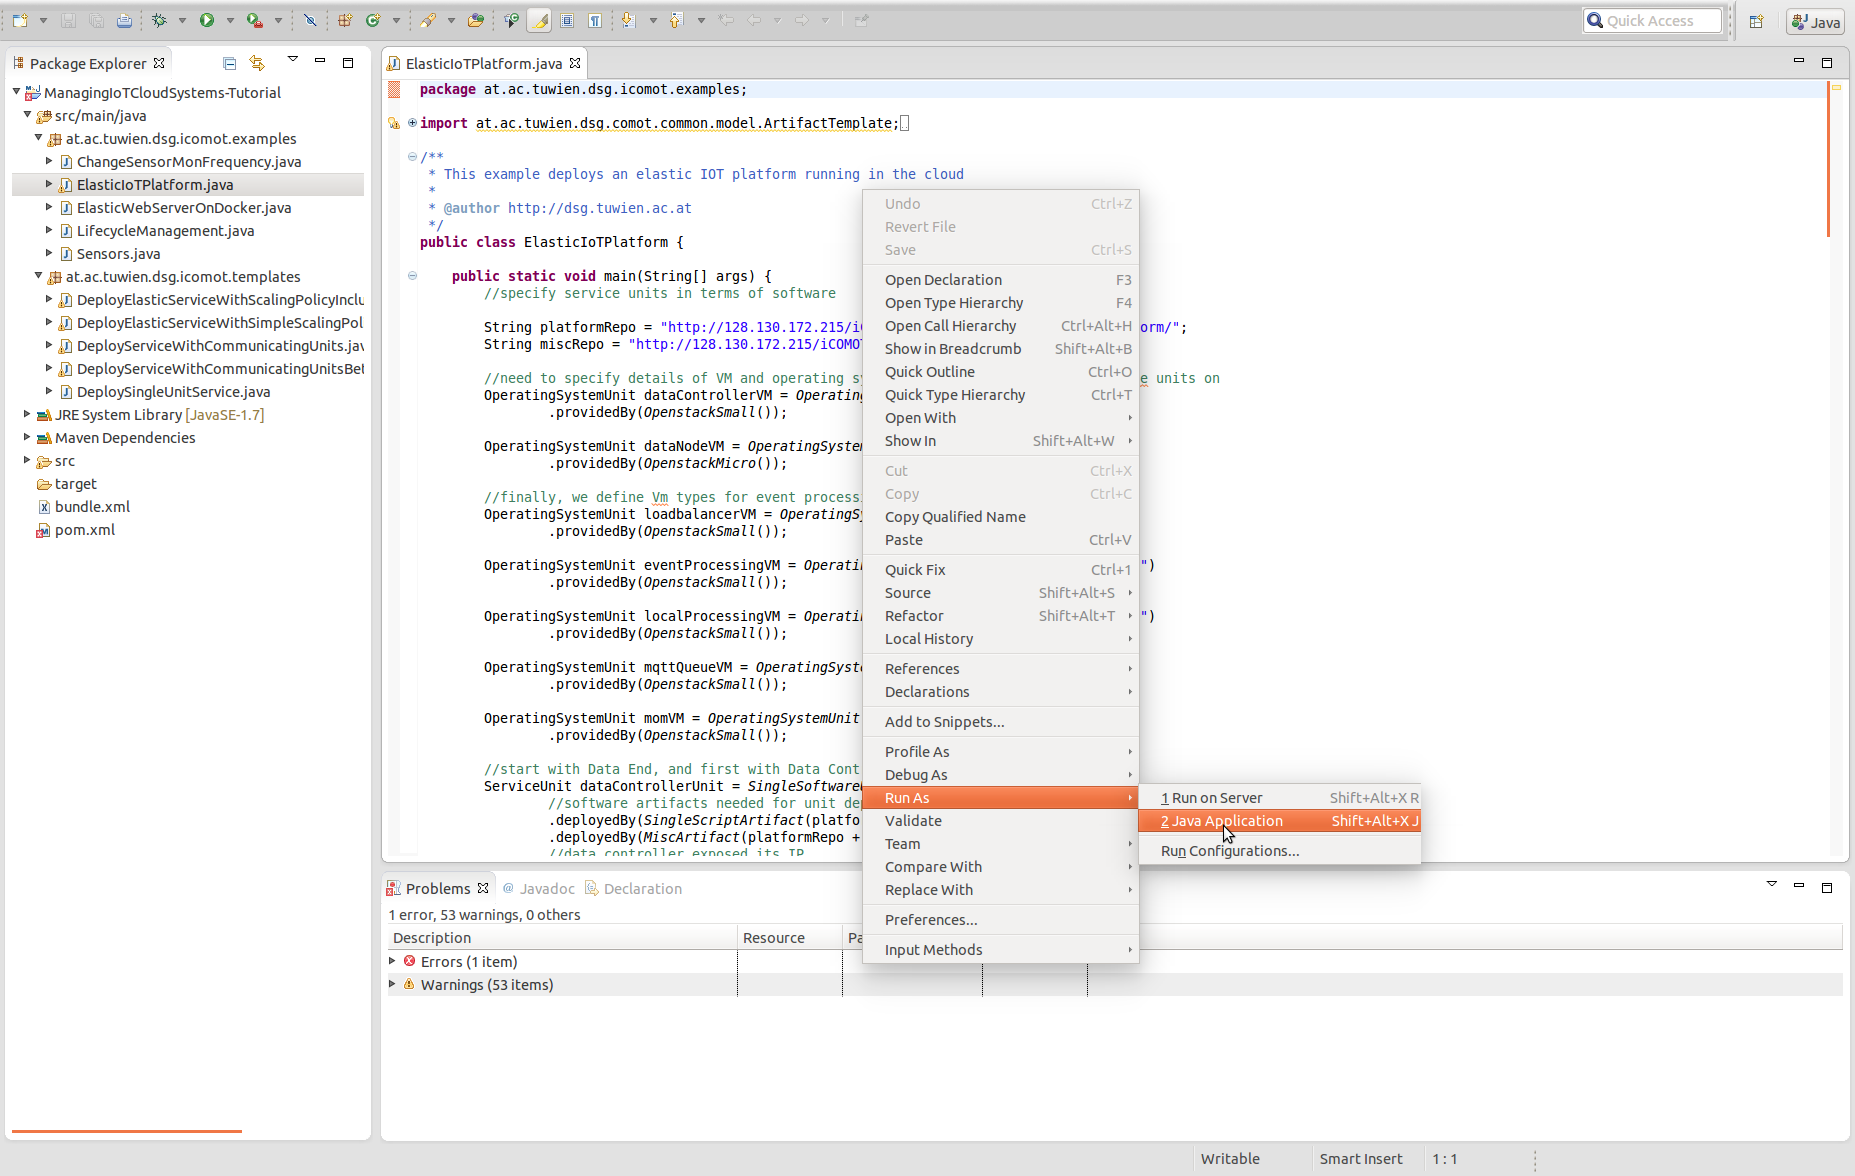
All the elasticity programming examples can be run from command line by running the compiled jar of the project, and passing as command line arguments the class to execute, and the necessary list of parameters in the form param=value. Available parameters are iCOMOT_IP, SALSA_PORT, SALSA_IP, rSYBL_IP, rSYBL_PORT, GovOps_PORT, GovOps_IP.
a. Download programming elasticity example project
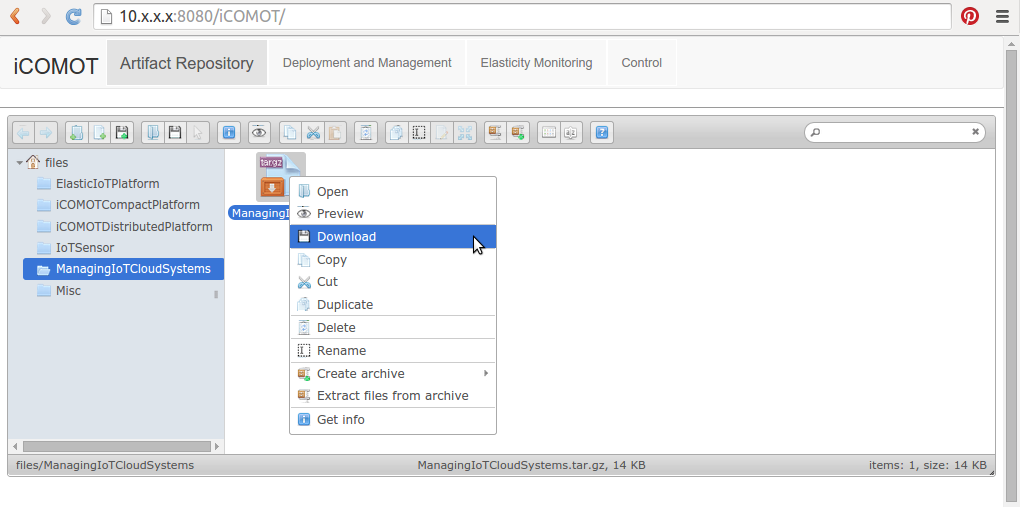
From the iCOMOT Dashboard "http://10.x.x.x:8080/iCOMOT", choose from Artifact Repository, the Programming Elasticity folder, and download and extract the JAVA Maven project ProgrammingElasticity.tar.gz
b. Run the programming elasticity example
Input the publicly accessible IP of iCOMOT (i.e., of the machine iCOMOT is deployed on) in ./src/at/ac/tuwien/dsg/icomot/examples, choose the ElasticIoTPlatform, change the IP of the controller to the one provided during iCOMOT deployment, and run the provided example:
Service Description
The service which is to be managed by iCOMOT can be described and managed at runtime through our iCOMOT API. Initially, the developer can specify (i) structural and deployment description, and (2) elasticity control requirements.
Structural and deployment description through iCOMOT API.
-
First, we describe the required deployment stack, starting with mentioning Docker as a base
OperatingSystemUnit privateVM = OperatingSystemUnit("PersonalLaptop").providedBy(LocalDocker()); Next, we describe the docker containers which will hold our software
	       //Docker container for load balancer
	       DockerUnit loadbalancerDocker = DockerUnit("LoadBalancerUnitDocker").providedBy(DockerDefault());

	       //Docker container for event processing
	       DockerUnit eventProcessingDocker = DockerUnit("EventProcessingUnitDocker").providedBy(DockerDefault());
We consider elasticity capabilities (i.e., what you can do with each unit) as first class citizens, which can have different properties. While in this case we use the default definitions of scaleOut and scaleIn, they could be more complex, such as specifying several primitives to be executed for each actions. For example, a scale out/in might imply "reconfigure load balancer", and then "de/allocate unit"
 	       ElasticityCapability scaleOutEventProcessing = ElasticityCapability.ScaleOut();
 	       ElasticityCapability scaleInEventProcessing = ElasticityCapability.ScaleIn();
A service can contain different software artifacts used to deploy and run it. Thus, we specify the location of the software repository holding our artifacts, in this case our own repository.
String salsaRepo = "http://128.130.172.215/iCOMOTTutorial/files/HelloElasticity/";As deploying an elastic service can imply service-specific configuration, each software unit is deployed by an artifact:
	       ServiceUnit eventProcessingUnit = SingleSoftwareUnit("EventProcessingUnit")
	       		                         .deployedBy(SingleScriptArtifact(salsaRepo + "deployEventProcessing.sh"));

	       ServiceUnit loadbalancerUnit = SingleSoftwareUnit("LoadBalancerUnit")
                                                 .deployedBy(SingleScriptArtifact(salsaRepo + "deployLoadBalancer.sh"));
To function, information about one service unit might be required by other units, such as for event processing to know the IP of the load balancer, to know where to register/deregister after an event processing instance is created/deallocated due to scaling actions
	       ServiceUnit loadbalancerUnit = SingleSoftwareUnit("LoadBalancerUnit")
                                                .exposes(Capability.Variable("LoadBalancer_IP_information"))

	       ServiceUnit eventProcessingUnit = SingleSoftwareUnit("EventProcessingUnit")
                                                .requires(Requirement.Variable("EventProcessingUnit_LoadBalancer_IP_Req"))

                                                //event processing receives IP from load balancer
	       ConnectToRelation("eventProcessingToLoadBalancer")
                                                .from(loadbalancerUnit.getContext().get("LoadBalancer_IP_information"))
                                                .to(eventProcessingUnit.getContext().get("EventProcessingUnit_LoadBalancer_IP_Req")),
Each unit might support/have enabled different elasticity capabilities
 	       ElasticityCapability scaleOutEventProcessing = ElasticityCapability.ScaleOut();
 	       ElasticityCapability scaleInEventProcessing = ElasticityCapability.ScaleIn();

 	       ServiceUnit eventProcessingUnit = SingleSoftwareUnit("EventProcessingUnit")
                                         .provides(scaleOutEventProcessing, scaleInEventProcessing)
Depending on individual implementations, we might want to specify certain actions to be executed during different stages of a unit's life-cycle, from deployment, to service unit start, stop and undeployment. In our pilot service implementation, the event processing unit must be gracefully shut down before a scale in, as to deregister itself from the load balancer
	       ServiceUnit eventProcessingUnit = SingleSoftwareUnit("EventProcessingUnit")
                                            .withLifecycleAction(LifecyclePhase.STOP, BASHAction("sudo service event-processing stop"));
Individual units can be grupped in higher level constructus, called topologies
	       ServiceTopology eventProcessingTopology = ServiceTopology("EventProcessingTopology")
                                            .withServiceUnits(loadbalancerUnit, eventProcessingUnit //add vm types to topology
                                            , loadbalancerDocker, eventProcessingDocker, privateVM
                                            );
The deployment order must be specified, to understand what is hosted on what
	       //load balancer software unit resides in its own docker container
	       HostedOnRelation("loadbalancerToDocker")
                                            .from(loadbalancerUnit)
                                            .to(loadbalancerDocker)
Elasticity requirements description
To be elastic, units can have strategies or constraints associated, which will be used to control the units' runtime behavior. While in the following we focus on strategies, which are imperative commands specifying what elasticity capability to enforce when, we also support constraints, which only state the desired behavior, and the controller must find automatically the best capability to enforce. For the latter case additional information is required, such as effect of enforcing each capability.
	    eventProcessingUnit. // scale in when response time and average throughput are low
			controlledBy(Strategy("EP_ST1")
				.when(Constraint.MetricConstraint("EP_ST1_CO1", new Metric("responseTime", "ms")).lessThan("100"))
				.and(Constraint.MetricConstraint("EP_ST1_CO2", new Metric("avgThroughput", "operations/s")).lessThan("200"))
				.enforce(ElasticityCapability.ScaleIn())
			).  // scale out when response time and average throughput are high
			controlledBy(Strategy("EP_ST2")
				.when(Constraint.MetricConstraint("EP_ST2_CO1", new Metric("responseTime", "ms")).greaterThan("100"))
				.and(Constraint.MetricConstraint("EP_ST2_CO2", new Metric("avgThroughput", "operations/s")).greaterThan("200"))
				.enforce(ElasticityCapability.ScaleOut())
			). // cost less than 400 for the EventProcessingServiceUnit
			constrainedBy(Constraint.MetricConstraint("EP_CO3", new Metric("cost", "$")).lessThan("400"));


		localProcessingUnit. // scale in when the data sending rate is low
			controlledBy(Strategy("LPT_ST1").when(Constraint.MetricConstraint("LPT_ST1_CO1", new Metric("avgBufferSize", "#")).lessThan("50"))
				.enforce(ElasticityCapability.ScaleIn()));
		localProcessingUnit. // scale out when the data sending rate is high
			controlledBy(Strategy("LPT_ST2").when(Constraint.MetricConstraint("LPT_ST2_CO1", new Metric("avgBufferSize", "#")).greaterThan("50"))
				.enforce(ElasticityCapability.ScaleOut()));
		dataEndTopology. // scale out when the cpu usage on the entire topology is too high
			 controlledBy(Strategy("EP_ST3")
				.when(Constraint.MetricConstraint("DET_CO1", new Metric("cpuUsage", "%")).lessThan("80"))
				.enforce(ElasticityCapability.ScaleOut())
				);
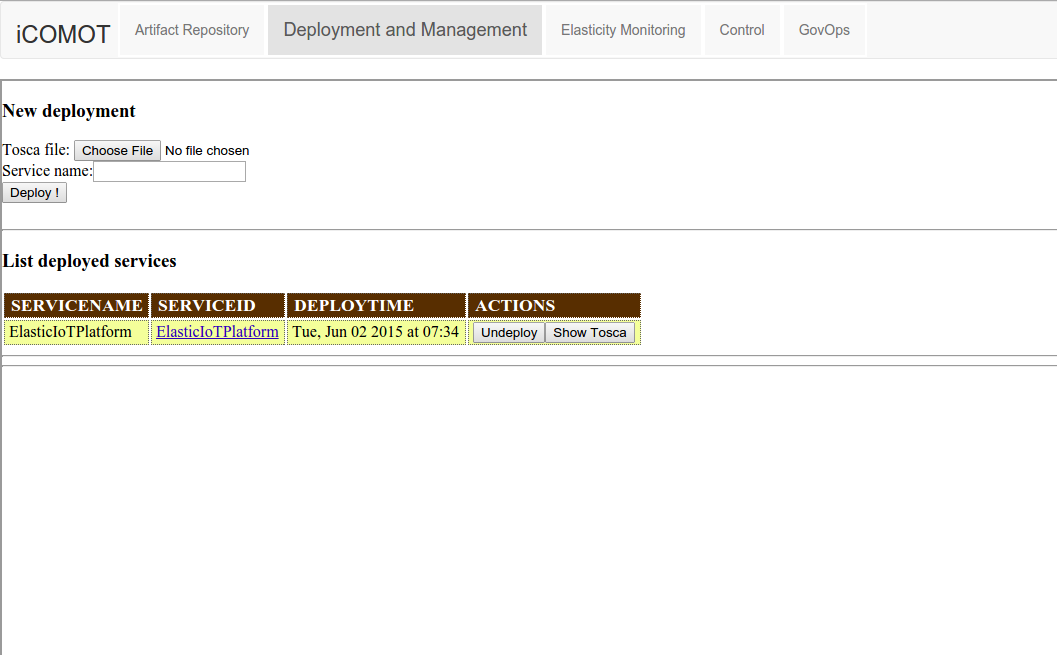
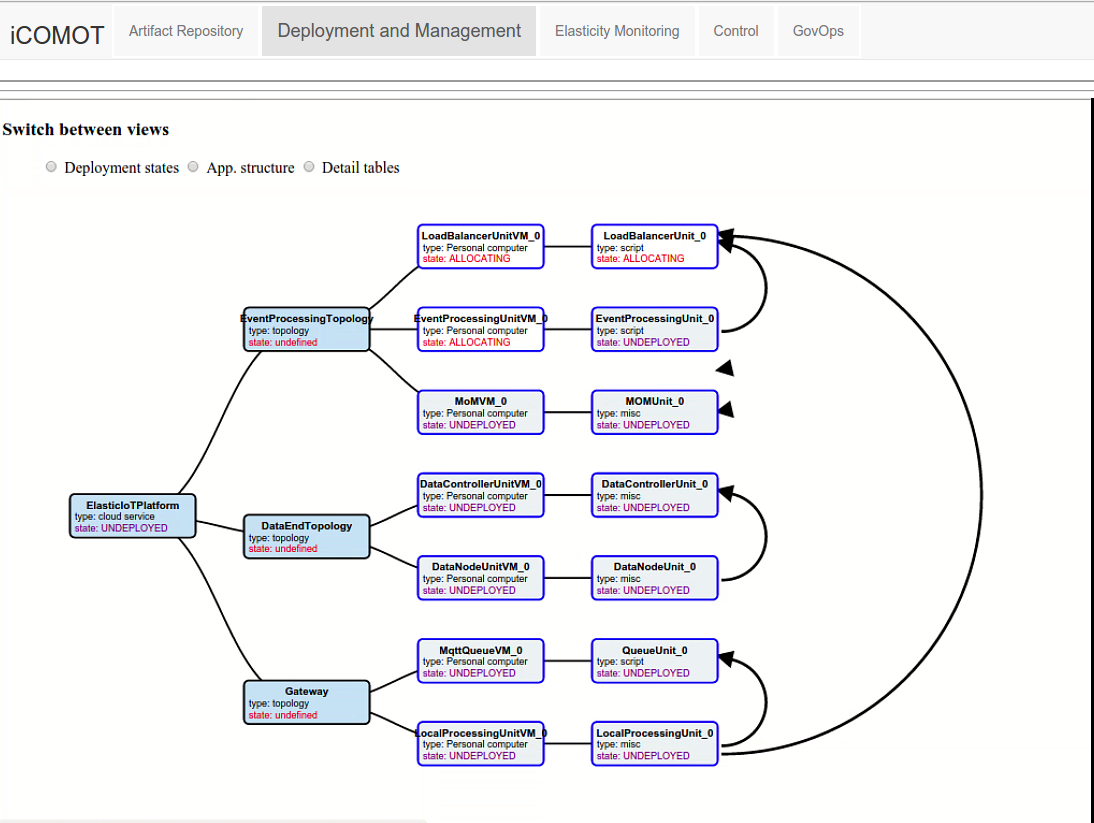
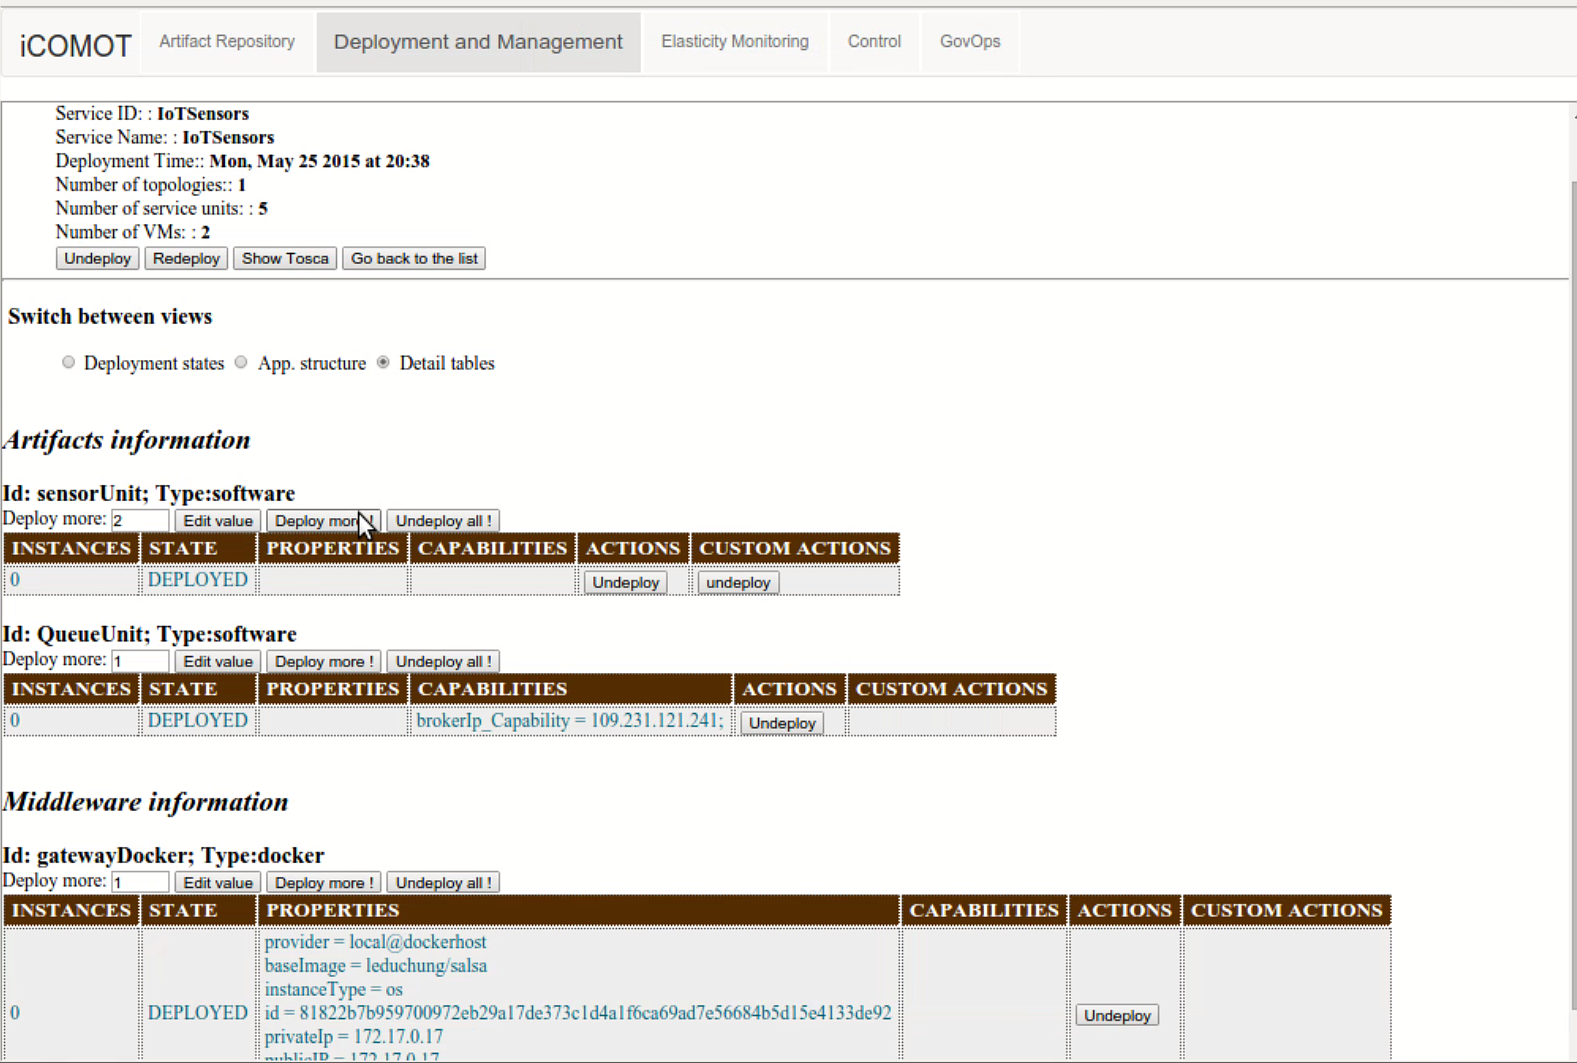
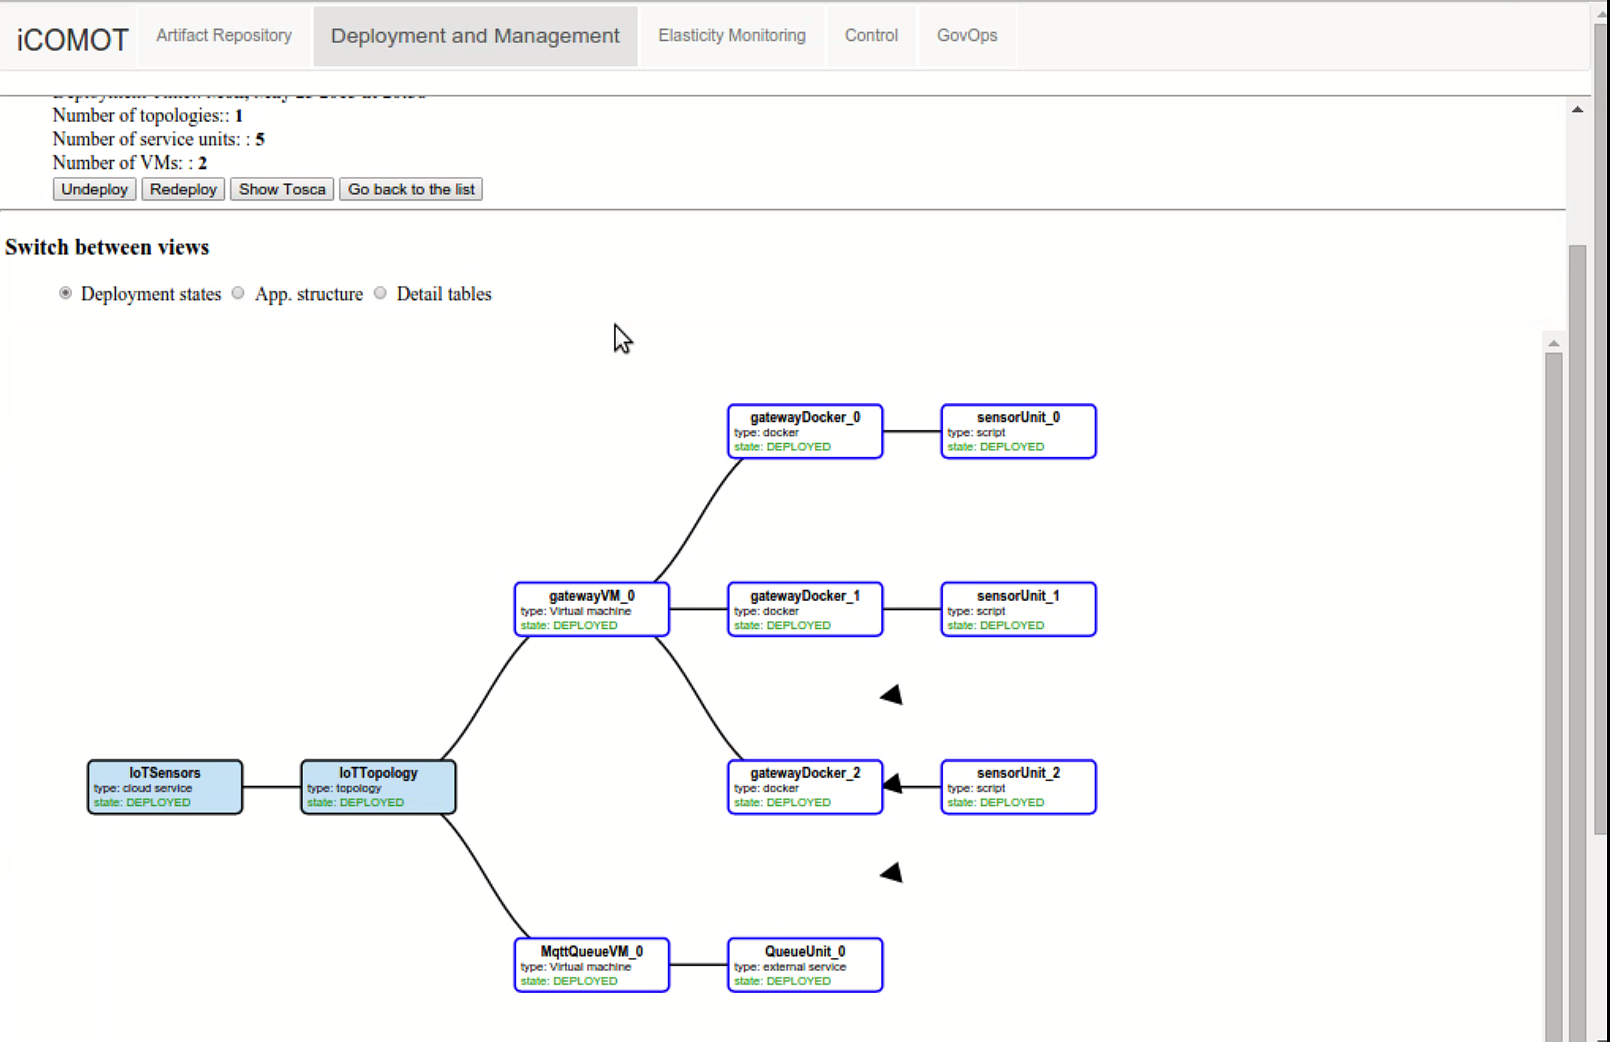
2. Visualize service deployment progress
Open iCOMOT Web and select the iCOMOT Web UI Deployment and Management Tab
3. Query capabilities of sensors
- Use the elise-client to query capabilities of all sensors. The command is available after install the /bin directory.
~$ ./elise-client.sh DEVICE
ELISE is collecting information ... -

Query: {"category":"DEVICE","rules":[],"hasCapabilities":[]}
Query UUID: ec9e2bad-b136-454e-8517-5b1d929c0d6c
Status of the query:

"10.0.0.8:8580":"DONE"

Press a key to get the result (not spacebar/return/specials)...

[A json of service instances' properties and capabilities]~$ elise-client DEVICE serviceID:EQUAL:sensorTopo1 4. Visualize service monitoring information
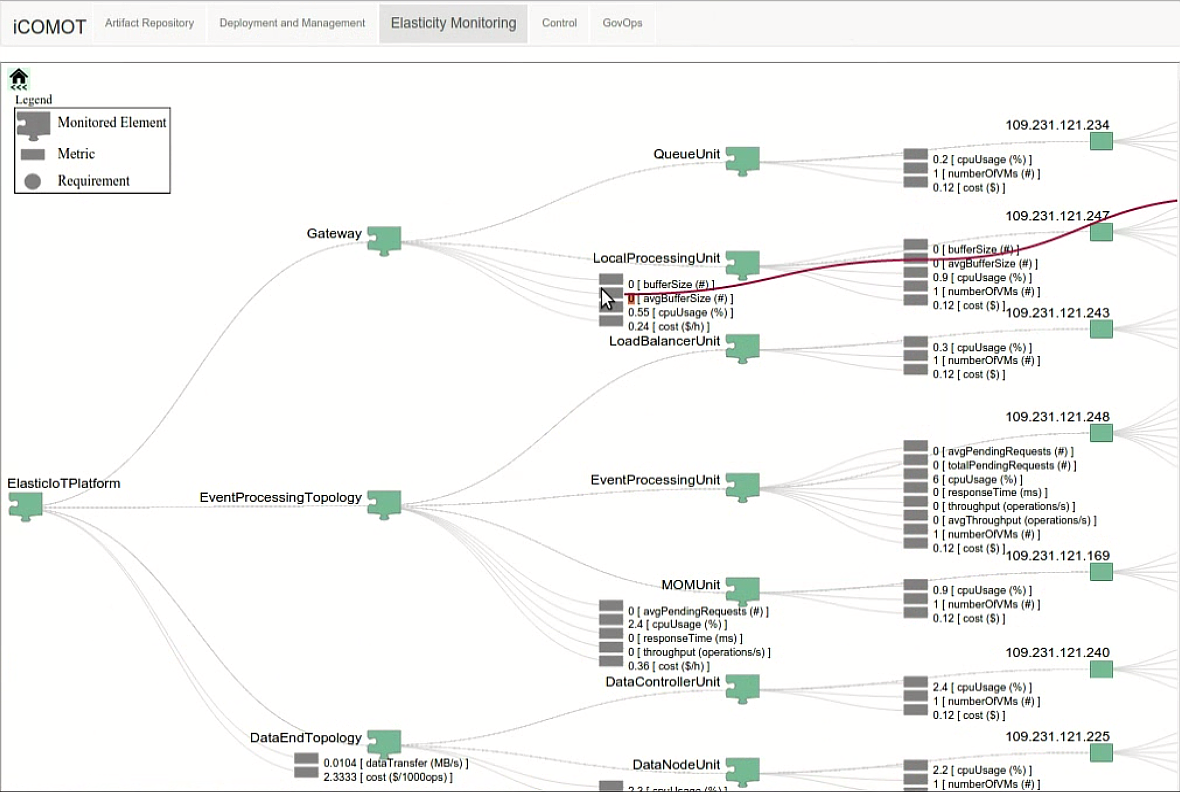
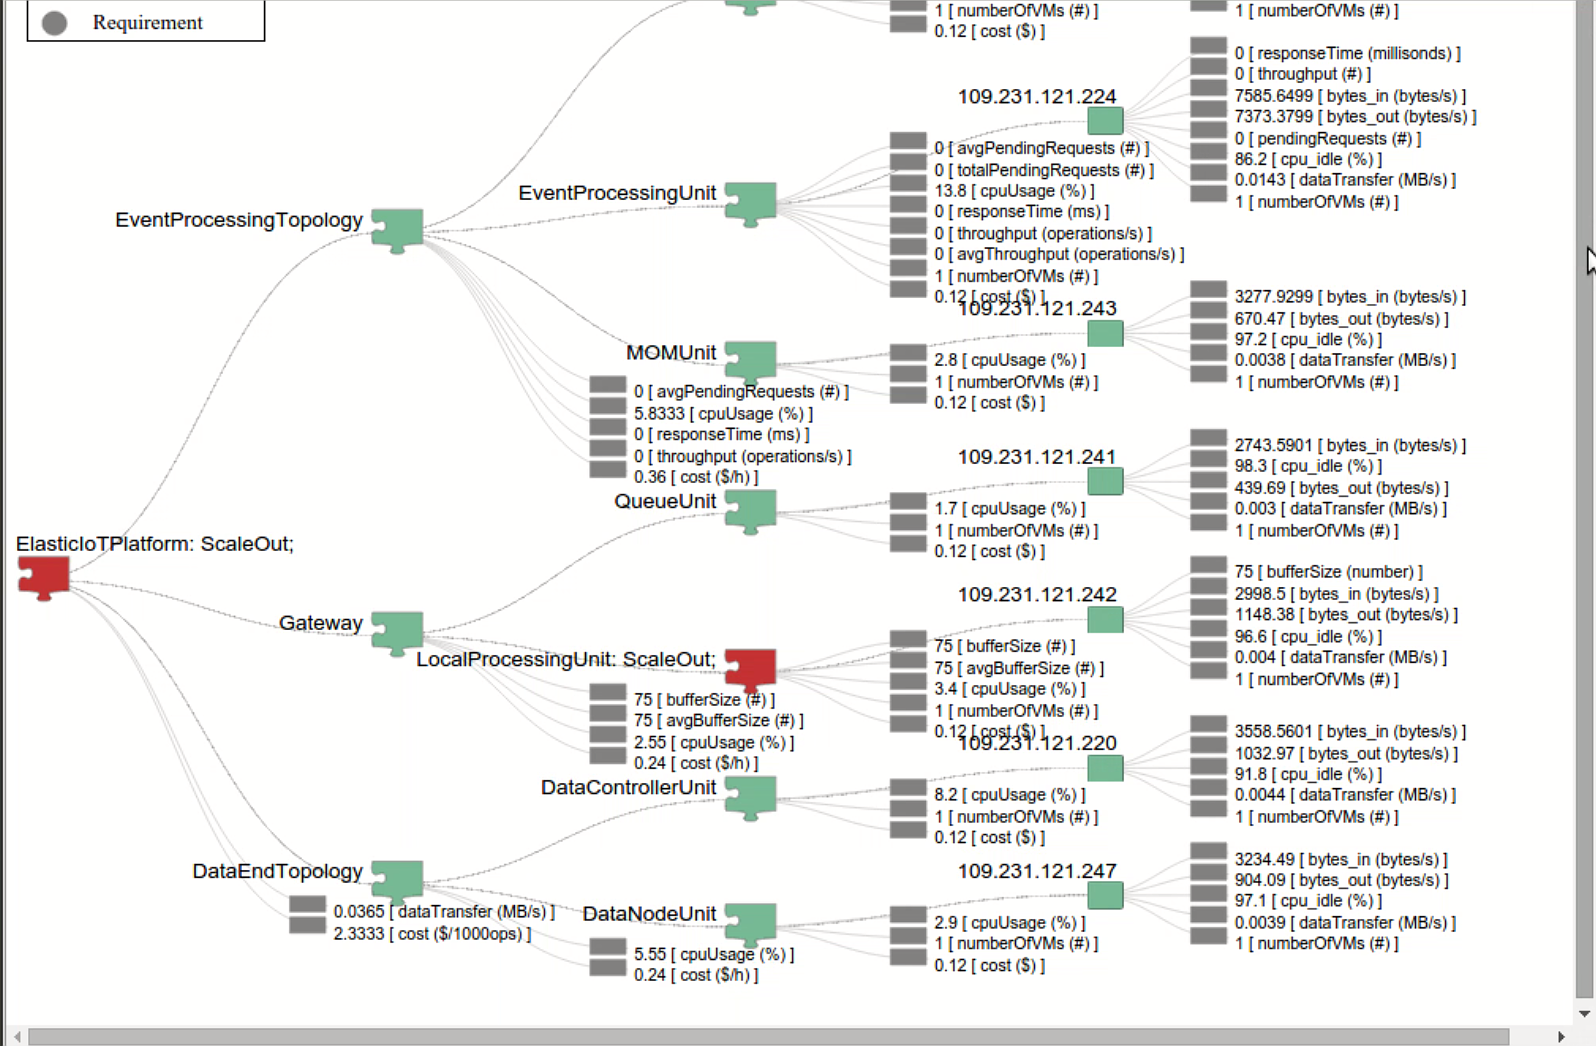
- Open iCOMOT Web and select the Elasticity Monitoring tab
- Select the service from the monitored services list
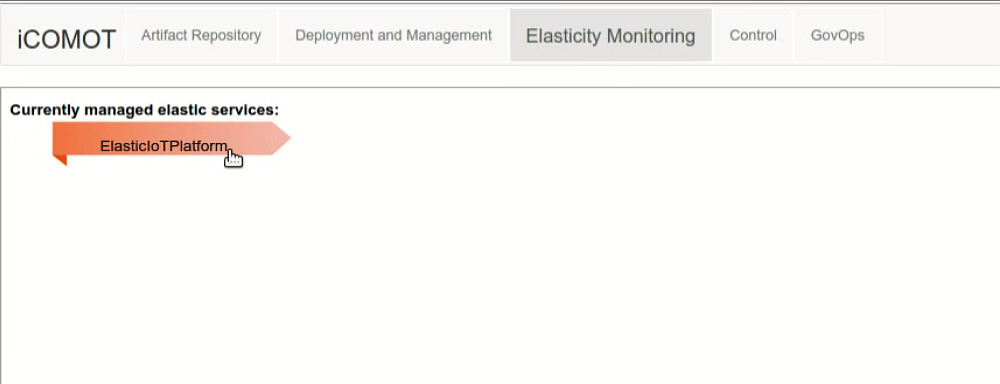
A hierarchical monitoring view will open, showing the elastic service, containing the specified topology, in turn made of units, which run on separate instances of docker containers (marked by their distinct IPs)
4. Visualize service elasticity requirements
- Open iCOMOT Web and select the Control tab
- Select the service from the monitored services drop-down list
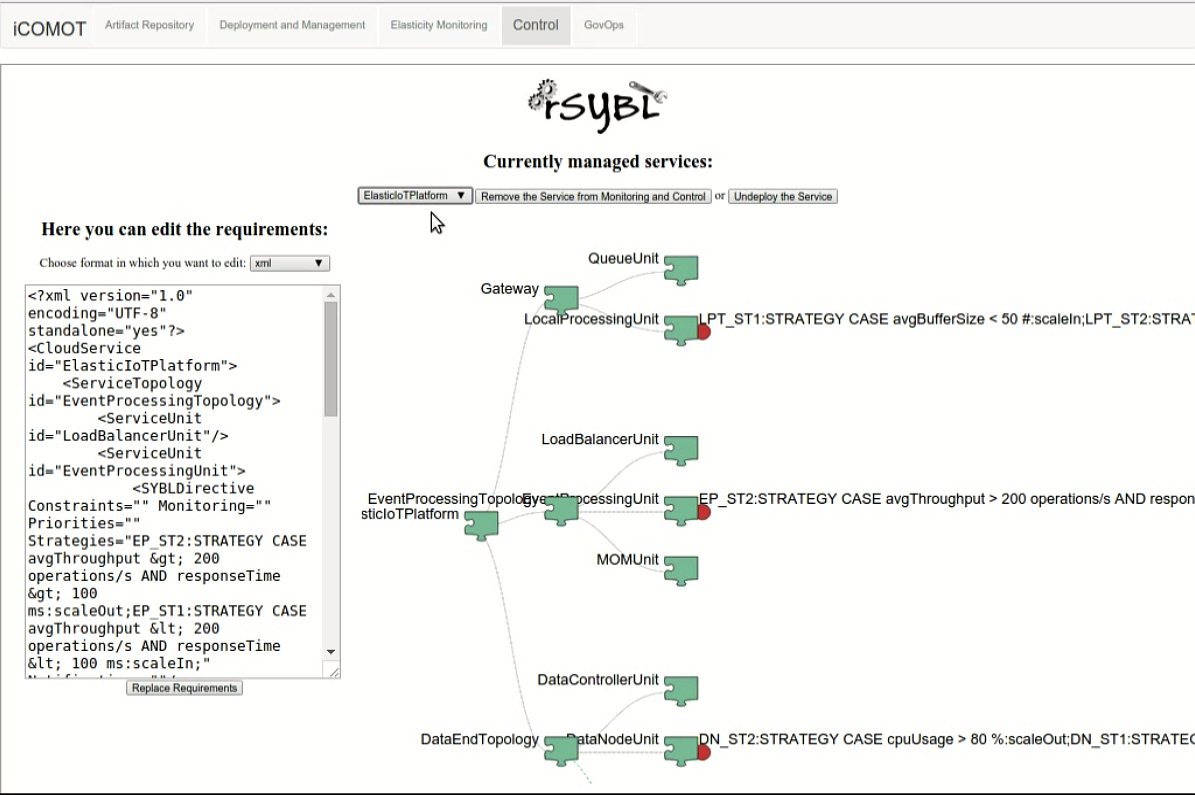
If required, a user can change the supplied elasticity requirements during run-time, using one of the supported editing formats.
5. Deploy simulated IoT Sensors
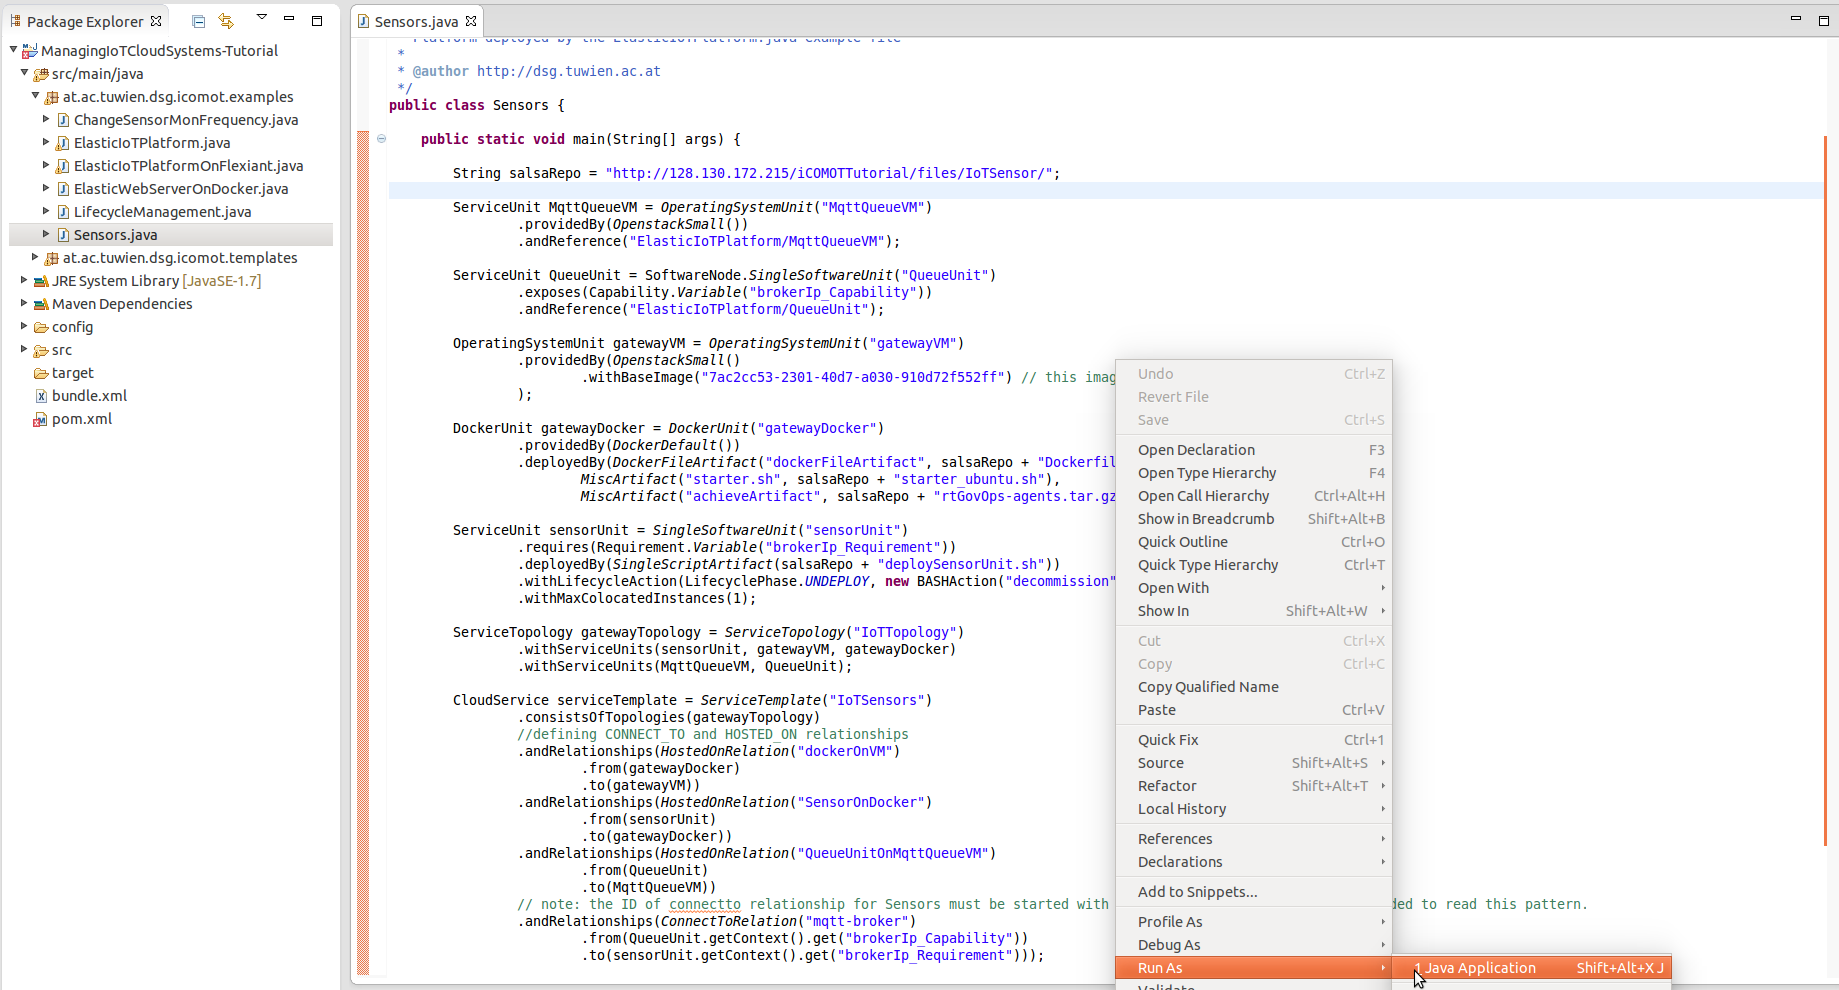
As for the ElasticIoTPlatform, we have prepared a Java description of a topology of IoT sensors to be deployed in the cloud, in ./src/at/ac/tuwien/dsg/icomot/examples/Sensors. Change the IP of the controller to the one provided during iCOMOT deployment, and run the provided example.
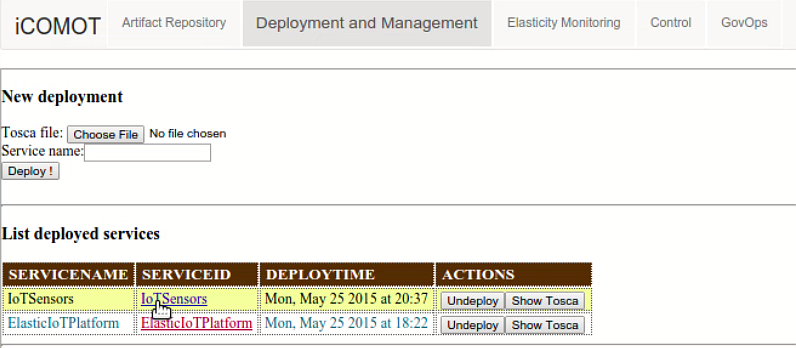
5. View and manage the simulated IoT Sensors in COMOT
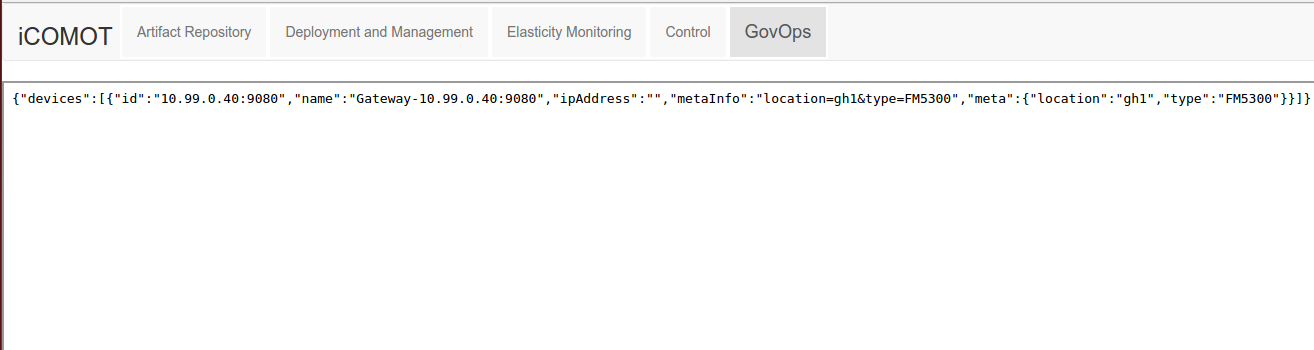
Open iCOMOT Web and select the iCOMOT Web UI Deployment and Management Tab, from which select the Sensors
Sensors are managed by GovOps. To see that sensor registered in GovOps automatically open iCOMOT Web and select GovOps tab. This will display the registered sensors, and their properties, such as type.
Additional sensors can be deployed using iCOMOT.
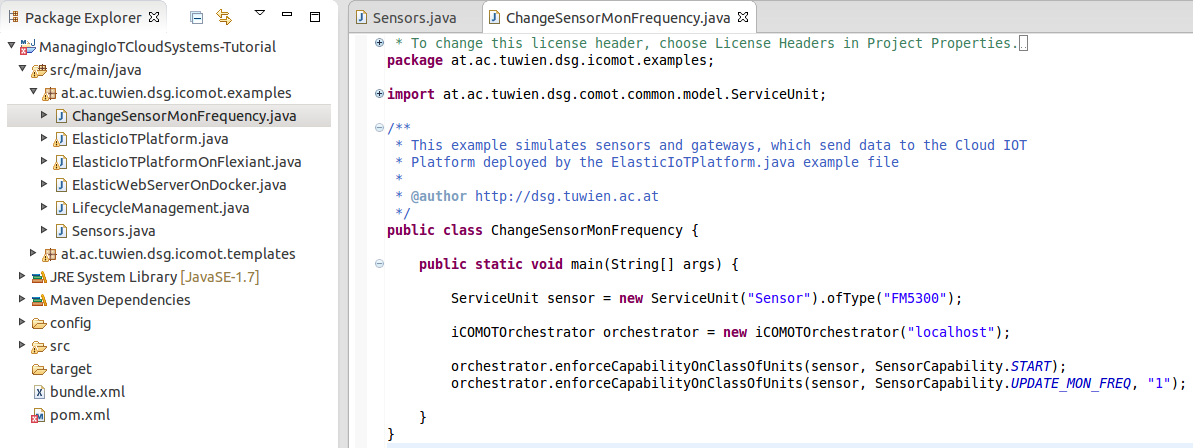
6. Control sensors
Sensors can have capabilities, which we can enforce through iCOMO. In this case we have the ability to start/stop sensors, and change the sensor monitoring rate. For this we have provided a JAVA API, used for updating the sensor monitoring requency to 1 second in ./src/at/ac/tuwien/dsg/icomot/examples/ChangeSensorMonFrequency
7. Run-time Elasticity of IoT Cloud Platform
Due to the inchrease in the number and update rate of sensors, the load on the elastic ito cloud platform inchreases, triggering a scale out action due to avg buffer size requirements. The scale out can be visualized in the Elasticity Monitoring tab.
8. Runtime elasticity and governance management with iCOMOT
Pause control while manual checks are performed
The controller can be paused (equivalent to breakpoints when testing) and resumed, for analyzing better the behavior of both the controller and the service.
			//pause control
			iCOMOTorchestrator.pauseControl(serviceTemplate);
			//resume control
			iCOMOTorchestrator.resumeControl(serviceTemplate);
Modify, during runtime, service behavior from elasticity control and governance perspective
The example bellow shows code excerpt for emergency scenarios, where (i) the acceptable cost is increased, (ii) the sensors are diversified (i.e., new sensors are added), and (iii) the sensors have the update monitoring frequency set to 1 second for the analytic systems to be able to process fresh information.
			//modify requirement EP_CO3 on cost, to approve bigger cost for current situation
			eventProcessingUnit.constrainedBy(Constraint.MetricConstraint("EP_CO3", new Metric("cost", "$")).lessThan("900"));
			iCOMOTorchestrator.updateServiceReqsOrStruct(serviceTemplate);

			//start new sensors of type FM5300 and specify the monitoring frequency at 1 second
			ServiceUnit sensor = new ServiceUnit("Sensor").ofType("FM5300");
			iCOMOTorchestrator.enforceCapabilityOnClassOfUnits(sensor, iCOMOTOrchestrator.SensorCapability.START);
			iCOMOTorchestrator.enforceCapabilityOnClassOfUnits(sensor, iCOMOTOrchestrator.SensorCapability.UPDATE_MON_FREQ, "1");
Demo flow video
Publications
Please find below relevant publications with respect to rSYBL, MELA, SALSA, and GovOps
Generic IoT Cloud Systems
- Hong-Linh Truong, Principles for Engineering Elastic IoT Cloud Systems, Invited Talk, SummerSOC 2015, 2nd July 2015.
- Hong-Linh Truong, Schahram Dustdar, Principles for Engineering IoT Cloud Systems, Cloud Computing, IEEE , vol.2, no.2, pp.68,76, Mar.-Apr. 2015 doi: 10.1109/MCC.2015.23, http://ieeexplore.ieee.org/stamp/stamp.jsp?tp=&arnumber=7116451&isnumber=7116413"
- Hong-Linh Truong, Georgiana Copil, Schahram Dustdar, Duc-Hung Le, Daniel Moldovan, Stefan Nastic, "iCOMOT - Toolset for Managing IoT Cloud Systems" (PDF), 16th IEEE International Conference on Mobile Data Management, 15-18 June, 2015, Pittsburg, USA. (Demo)
rSYBL
- Georgiana Copil, Demetris Trihinas, Hong-Linh Truong,Daniel Moldovan, George Pallis, Schahram Dustdar, Marios Dikaiakos, "ADVISE - a Framework for Evaluating Cloud Service Elasticity Behavior", the 12th International Conference on Service Oriented Computing. Paris, France, 3-6 November, 2014. BEST PAPER AWARD, http://link.springer.com/chapter/10.1007/978-3-662-45391-9_19, ppt
- Georgiana Copil, Daniel Moldovan, Hong-Linh Truong, Schahram Dustdar, (Short Paper), "Multi-Level Elasticity Control of Cloud Services", the 11th International Conference on Service Oriented Computing. Berlin, Germany, 2-5 December, 2013 http://dx.doi.org/10.1007/978-3-642-45005-1_31.
- Georgiana Copil, Daniel Moldovan, Hong-Linh Truong, Schahram Dustdar, "SYBL: an Extensible Language for Controlling Elasticity in Cloud Applications",13th IEEE/ACM International Symposium on Cluster, Cloud and Grid Computing (CCGrid), May 14-16, 2013, Delft, the Netherlands, http://dx.doi.org/10.1109/CCGrid.2013.42, ppt
MELA
- Daniel Moldovan, Hong-Linh Truong, Schahram Dustdar, "Cost-aware scalability of applications in public clouds", International Conference on Cloud Engineering, IC2E, IEEE, Berlin, Germany, 4-8 April, 2016, paper, ppt
- Daniel Moldovan, Georgiana Copil, Hong-Linh Truong, Schahram Dustdar, "On Analyzing Elasticity Relationships of Cloud Services", 6th International Conference on Cloud Computing Technology and Science, 15-18 December 2014, Singapore, 10.1109/CloudCom.2014.93
- Daniel Moldovan, Georgiana Copil, Hong-Linh Truong, Schahram Dustdar, "MELA: Elasticity Analytics for Cloud Services", International Journal of Big Data Intelligence, Special issue for publishing IEEE CloudCom 2013 selected papers
- Daniel Moldovan, Georgiana Copil, Hong-Linh Truong, Schahram Dustdar, "MELA: Monitoring and Analyzing Elasticity of Cloud Services", 5'th International Conference on Cloud Computing, CloudCom, Bristol, UK, 2-5 December, 2013, http://dx.doi.org/10.1109/CloudCom.2013.18, ppt
SALSA
- Duc-Hung Le, Hong-Linh Truong, Georgiana Copil, Stefan Nastic and Schahram Dustdar, "SALSA: a Framework for Dynamic Configuration of Cloud Services", 6th International Conference on Cloud Computing Technology and Science, 15-18 December 2014, Singapore, 10.1109/CloudCom.2014.99
GovOps
- Stefan Nastic, Christian Inzinger, Hong-Linh Truong, and Schahram Dustdar. "GovOps: The Missing Link for Governance in Software-defined IoT Cloud Systems" (PDF). The 10th International Workshop on Engineering Service Oriented Applications (WESOA’14) in conjunction with ICSOC 2014, 3. November 2014, Paris, France.
- Stefan Nastic, Michael Vögler, Christian Inzinger, Hong-Linh Truong, and Schahram Dustdar, "rtGovOps: A Runtime Framework for Governance in Large-scale Software-defined IoT Cloud Systems", 3rd IEEE International Conference on Mobile Cloud Computing, Services, and Engineering, Mar 30 – Apr 3, 2015, San Francisco, CA, USA. doi: 10.1109/MobileCloud.2015.38